
FAQs
Frequently Asked Questions
Frequently asked questions about Microfluidic Modulation Spectroscopy and the biomolecule measurements of Aggregation, Quantitation, Structure, Stability, and Similarity that MMS can obtain with unrivaled precision and speed.
Aggregation Measurement
What is biomolecular aggregation?
Biomolecular aggregation is a biological phenomenon where individual macromolecules, such as protein molecules cluster and clump together, forming a new entity that might have lost its original functions or activities and have the potential to cause diseases. Specifically, protein aggregation is a result of protein mis-folding, causing individual proteins to interact with one another. In the most severe cases, protein aggregation leads to the formation of irreversible, insoluble fibril structures, e.g., β-amyloids, which are responsible for neurodegenerative diseases such as Alzheimer’s and Huntington’s.
Aggregation Measurement
Which molecules are most susceptible to aggregation?
In non-stressed conditions, peptide formation during translation and newly expressed proteins during the folding process are susceptible to aggregation. Proteins that are under stressed conditions (I.e., heat, pH, oxidative, etc.) are also susceptible to aggregation.
Aggregation Measurement
What causes protein aggregation?
The direct cause of protein aggregation results from interactions between individual proteins that become thermodynamically favored. There are two main sources of such driving force behind protein aggregation:
- The surface of proteins loses interaction with solvents (i.e., water molecules) and consequently exposes the hydrophobic groups that can interact with the surface of another protein undergoing the same process. Aggregates formed by such surface interactions are called colloidal aggregates.
- Mis-folded proteins fail to maintain the native structure and expose the inner hydrophobic pockets. The exposed hydrophobic pockets, primarily composed of β sheets, are prone to re-form beta interactions indiscriminately with other intra- and inter-molecular β sheets. Aggregates formed by these intermolecular β-sheets are called structural aggregates.

Aggregation Measurement
Can protein aggregation occur at all steps of the drug development process?
Yes, protein aggregation can occur at all stages of the drug development process, including early discovery, pre-clinical research and development, formulation, and clinical development. Common factors that can cause protein aggregation in early discovery stage include process temperature of proteins, freeze/thaw cycles of proteins, agitation stress of proteins, protein concentration, etc. It is also important to be able to detect early signs of protein aggregation or just the potential of protein aggregation during the early discovery phase.
Aggregation Measurement
What are the different types of protein aggregates and how do they form?
There are two different types of protein aggregates – colloidal protein aggregates and structural protein aggregates. Colloidal protein aggregates refer to the self-association of protein molecules that are still well folded in their native structure. Structural protein aggregates are the aggregates in which the protein molecules are no longer in their native folded states but a different structure. Conformational or structural protein aggregation often involves the formation of intermolecular β-sheets which is irreversible, while colloidal protein aggregates are often still reversible.
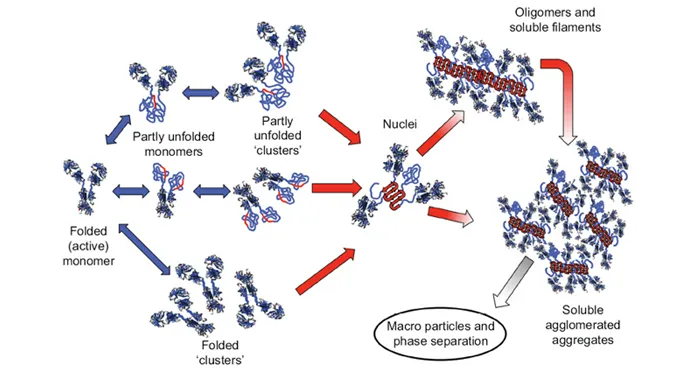
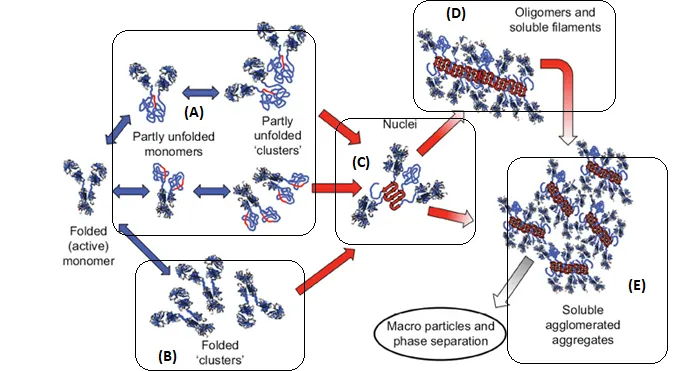
There are multiple pathways that lead to protein aggregation, as illustrated in the figure below by Christopher J. Roberts et al. (A) represents the process from partly unfolded protein monomers to partly unfolded clusters, while (B) represents colloidal protein clusters where proteins are folded well in their native structures. Both (A) and (B) protein aggregates are still reversible until it reaches (C) where inter-molecular β-sheets have formed, and it will function as nuclei that triggers further aggregation into oligomers, soluble filaments, and agglomerated aggregates. As a result, protein aggregation rates are governed by conformational and colloidal stabilities, demonstrated by John Carpenter, Eva Y. Chi et al, and many other researchers and scientists.
MMS provides a way to assess protein colloidal stability (via protein hydration) and structural or conformational stability (via secondary structural analysis) in one single automatic measurement. Stay tuned for an upcoming app note.
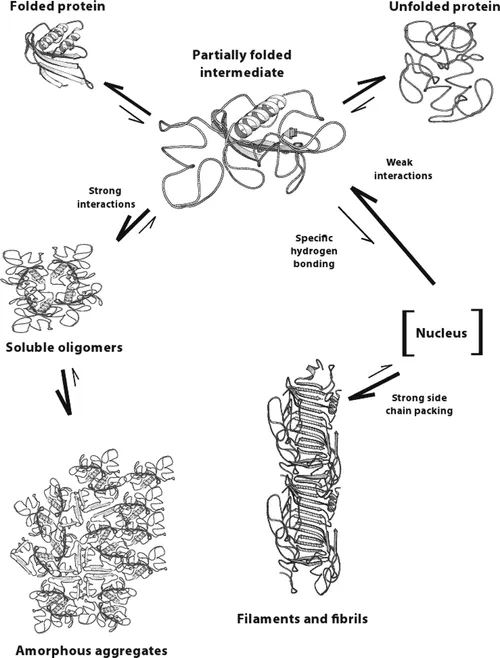
Schematic diagram below illustrates multiple non-native aggregation pathways for a multi domain protein such as a monoclonal antibody (mAb) composed of a single Fc fragment and two identical Fab fragments. Red strands denote ‘hot spot’ sequences that are prone to form strong, effectively irreversible inter-protein contacts that stabilize aggregates, but are primarily hidden or buried in fully folded monomers. Double arrows denote effectively reversible steps. Single arrows denote irreversible steps. Nuclei are defined as the smallest net-irreversible aggregates that form soluble aggregates spanning length scales on the order of 10 to 102 nm. This occurs primarily via addition of other partly unfolded monomers (upper right) or by the agglomeration of existing aggregates (lower right) [ref].
Another way to look at different types of protein aggregates, as demonstrated by Leonid Breydo et al. and Bhavana Shivu et al., protein aggregates can be divided into three structural classes: amorphous aggregates, amyloid fibrils, and oligomers. The formation of the amorphous aggregate involves the association of the solvent-exposed hydrophobic surfaces of the nativelike cores of the intermediates accompanied by the formation of intermolecular β-sheets between disordered loops, which first yields small soluble oligomers that increase in size to generate larger aggregates. Amyloid fibril formation, however, involves initial weaker hydrophobic interactions, resulting in a soluble oligomeric pre-nucleus that probably has more β-sheet formation between the disordered segments of the intermediate.
Aggregation Measurement
How is aggregation detected and measured (tools, etc)?
Although protein aggregates can be both colloidal aggregates and structural aggregates, today’s labs almost always only quantify size using HPLC, SEC, and AUC, techniques which do not differentiate the two types of protein aggregates.
In the figure above, B-C-D-E will all appear to be a size change with no way to distinguish them apart. With the addition of MMS, we can distinguish A, B, C, D, E. More specifically, A has an overall structural change but little intermolecular β-sheets, B has no overall structural changes (spectra identical); C, D, E have both overall structure changes and intermolecular β-sheets.
Analytical tools used to detect protein aggregation
Several common analytical tools used to detect aggregates include: HPLC, SEC and AUC. These do not differentiate between two types of intermolecular aggregation. MMS is able to do this.


Aggregation Measurement
Which secondary structures are associated with aggregation and the current limitations to detect such?
Proteins are comprised of chains of amino acids which, in specific order, dictate structure and function as the primary structure. Aggregation is most notably associated with β-sheet formation, a structure that is present in protein biomolecules in varying amounts. Other structures that contribute to the overall secondary structure, folding, function and activity of proteins include alpha-helices, turns, and unordered regions.
As demonstrated above, the formation of intermolecular β-sheet is key to irreversible protein aggregation. However, the attention that researchers in the biopharmaceutical space pay to protein secondary structure and intermolecular β-sheet does not match their importance. This is primarily due to the limitations of traditional tools, especially their low sensitivities. That is to say, no meaningful conclusion can be drawn unless there is a very large change in protein secondary structure that goes beyond the system error.
KBI has published a paper to compare the Limit of Quantification (LOQ) of traditional Fourier-transform infrared (FTIR) spectroscopy, Circular dichroism (CD) and Microfluidic Modulation Spectroscopy (MMS) by Brent S. Kendrick et al. LOQ is defined as the smallest amount or the lowest concentration of a substance that is possible to be determined by means of a given analytical procedure with the established accuracy, precision, and uncertainty. MMS is 30 times more sensitive than traditional FTIR and 5 times more sensitive than CD.

Determining Spectroscopic Quantitation Limits for Misfolded Structures
Abstract
“Protein secondary structures are frequently assessed using infrared and circular dichroism spectroscopies during drug development (e.g., during product comparability and biosimilarity studies, reference standard characterization, etc.) However, there is little information on the lower limits of quantitation of structural misfolds and impurities for these methods. A model system using a monoclonal antibody reference material was spiked at various levels with a protein that had a significantly different secondary structure to represent the presence of a stable and discreet structural misfold. The ability of circular dichroism, transmission Fourier transform infrared spectroscopy and microfluidic modulation spectroscopy, along with various spectral comparison algorithms, were assessed for their ability to detect the presence and quantify the amount of the misfolded structure.”
Aggregation Measurement
How can solutions be stabilized to avoid aggregation?
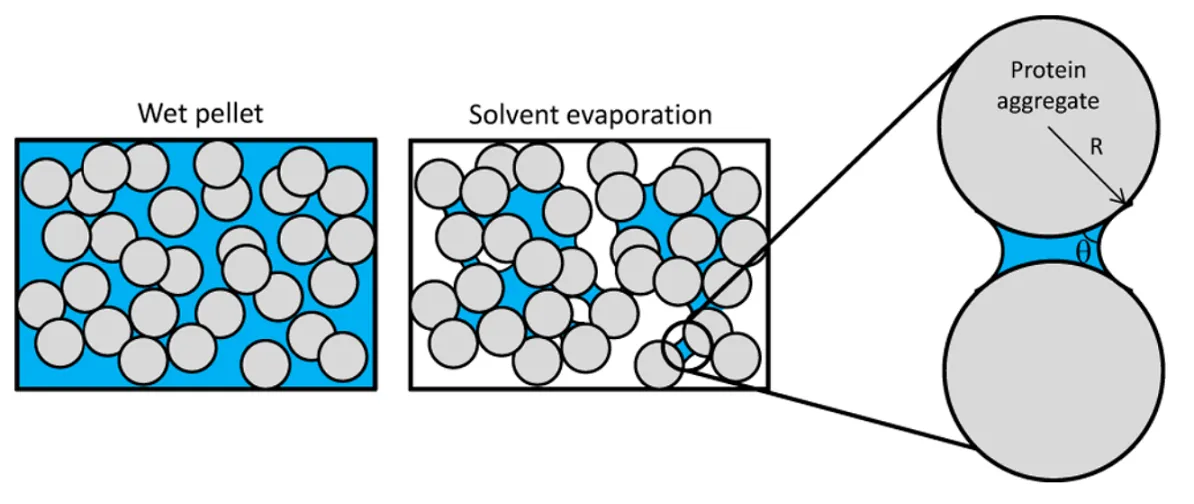
To stabilize a protein formulation to avoid aggregation, we need to know how proteins are aggregated. For proteins to aggregate, the first step is to approach ~3 Å, the second step is desolvation – the removal of everything between the two proteins including water and other molecules in the formulation. Then proteins can go through structural changes over time and eventually form intermolecular β-sheets to be irreversibly aggregated. This serves as a nucleus for the formation of more intermolecular β-sheets and eventually large aggregates.
Excipients are the developer’s ingredients for engineering stable formulations. Different excipients provide different influence and control over different steps described above. The first step is governed by proximity energy and can be hindered via electrostatics, e.g. protein charges, therefore, controlling over pH, ionic strength and dielectric can be very effective.
The second step – desolvation – is governed by protein hydration and exclusive volume. Sugars, some amino acids, can help control protein hydration. Some polymeric chains can be linked to protein surfaces to increase the exclusive volume, therefore stabilizing the protein formulation.
Aggregation Measurement
Is all protein aggregation reversible/irreversible?
Protein aggregation can be both reversible and irreversible. Theoretically, if the protein molecule still maintains its natively folded structure, it can still be reversibly separated into single molecules. Therefore, colloidal aggregates are usually considered reversible. However, once intermolecular β-sheets have formed between protein molecules, there would be no way to reverse it back to individual protein’s native states, therefore, irreversible. One may test the reversibility by removing the stress and/or diluting the sample.
Aggregation Measurement
How do I setup an experiment to find the formulation condition where protein aggregation is starting?
Accelerated stability studies are usually performed on protein drug products as part of the formulation screen to see how resilient each formulation is to stress conditions like heat, agitation, freeze/thaw cycles, and light exposure. This type of study will also help inform the researcher on how shelf-stable the drug product is. The formulations to be tested should include a range of pH values and additives such as sugars, salts, preservatives, and stabilizers like amino acids. The goal of this study is to determine which protein drug formulation can withstand the most stress without the drug product aggregating.
Aggregation Measurement
What can be done if aggregation is detected?
If protein aggregation is detected, this is an alarming sign for potential product failure, e.g. due to loss of protein function and/or unwanted interaction. The course of action resembles that of how to prevent protein aggregation (See FAQ: Reasons to Avoid Aggregation) and depends critically on where along the biotherapeutic pipeline it is detected.
In the early development phase, i.e. formulation, there are still more degrees of freedom in both the buffer recipe and the protein itself, in order to stabilize the product. The strategy depends on the type of aggregation: Reversible colloidal protein association is often approached by controlling the electrostatics through salt and buffer components, structural protein aggregation might require changes to the protein sequence. In general, protein structures with a more densely packed (hydrophobic) core tend to be more stable. In manufacturing, the product recipe is already more sophisticated and potential changes are limited to fine tuning the buffer components. Detecting structural protein aggregation at this point is a major setback for the release of this product. For released products, aggregation is a serious quality issue which requires retraction of that product and adjustments in the buffer and/or the protein sequence.
Aggregation Measurement
What are the reasons to avoid aggregation?
Protein aggregates can be immunogenic. It is generally accepted that the immunogenic risk of aggregated protein drug molecules is correlated with its reversibility. Specifically, irreversible protein aggregates are more immunogenic. For the same mass of materials, smaller (e.g. 20nm) protein aggregates have a stronger immunogenic response due to the much greater amount of them. [1, 2]
MMS can quantify intermolecular protein β-sheets with ultra-sensitivity. This will determine the amount of irreversible protein aggregates which cannot be achieved by measuring size using DLS, NTA, MFI, or SEC. Here are some app notes that demonstrate how MMS irreversible protein aggregation.
AN_850_0109 - Detection of Pressure Induced aggregation using MMS
Abstract:
The RedShiftBio AQS3®pro system, powered by Microfluidic Modulation Spectroscopy (MMS), enables the early detection of instability by measuring minute changes in inter-molecular β-sheet composition, an indicator of irreversible aggregation. The AQS3pro utilizes a high-power quantum cascade laser (QCL) to generate unrivaled sensitivity in secondary structure determination over a wide concentration range. The ability to see change in inter-molecular β- sheet composition through stability monitoring at selected wavenumbers by MMS creates an advantage of correlating drug development conditions to potential detrimental effects on protein function at all stages of drug development.
AN_850_0101 Thermal Denaturation Analysis of Bovine Serum Albumin over Wide Concentration Range by Microfluidic Modulation Spectroscopy
Abstract:
Microfluidic Modulation Spectroscopy (MMS) is a powerful new infrared spectroscopy tool for protein structural analysis developed by RedShift BioAnalytics. This technology provides significant increases in sensitivity, dynamic range, and accuracy for determination of protein secondary structure relative to conventional mid-IR and far-UV CD techniques. The analyzer utilizes a tunable Quantum Cascade Laser that is at least 1000 times more intense than conventional light sources, allowing for optimal signal-to-noise ratio to achieve ultra-high sensitivity. This sensitivity allows MMS to see changes missed by other technologies and gives you greater confidence in your biophysical characterization. More intense light sources also allow the use of simpler detectors without the need for liquid nitrogen cooling. Additionally, the sample (protein) solution and a matching reference buffer stream are automatically introduced into a microfluidic flow cell, and the two fluids are rapidly modulated (1-4 Hz) across the laser beam path to produce nearly drift-free background compensated measurements.
Aggregation Measurement
Can I use micro-filtration to remove aggregates?
Protein aggregates and other large particulates can be removed from samples that are being prepared for MMS typically by using a 0.2 um filter, or centrifuging to pellet the aggregates and use the supernatant. Removing large protein aggregates and particulates will help extend the lifetime of the flow cell as large aggregates can accumulate in the flow cell and slow the flow rate over time. If the flow rate slows, the options are to perform cleaning procedures or replace the flow cell with a new one.
Aggregation Measurement
If aggregation is so bad, how can I prevent it?
Knowing the aggregation pathway will save your time and effort in solving your protein aggregation problems, developing formulations, and narrowing down leads. To solve reversible protein colloidal association, we usually consider controlling electrostatics using salt and buffers, i.e. to increase the charges or adjust the charge distributions on the surface). To alleviate reversible protein structural unfolding, we usually consider controlling co-solute affinity which governs the desolvation step using sugars and amino acids and the like. Or if that's not working, we may go back to choose another lead that has a "better" protein structure. "Better" means the protein can form a tighter hydrophobic core.
Aggregation Measurement
Is it possible to increase protein solubility using formulations to prevent precipitation and protein aggregation?
Formulations can absolutely help increase solubility! One of the most important features to get right in a formulation buffer is the pH. In addition to finding the right buffer, there are also many different additives that can help stabilize or solubilize your protein. Some of these additives include salts to help balance ionic strength, sugars to help with the protein’s hydration, detergents to act as an emulsifier or to protect the protein from aggregating, and amino acids can help balance charges.
Stability Measurement
What does the term biomolecular stability refer to?
Biomolecular stability refers to the ability of a biomolecule to withstand external stress, i.e., to keep its designated structure and activity. Most often increasing temperature is used to determine stability, but other stresses could be used too, such as pH or agitation. The relevant stability is determined by the stress-induced loss in a structure that already gives rise to a loss of function, too. This could be due to a structural change around the active site of that protein. In addition to that, proteins often have intermediate states that still conserve some part of their native structures and with some residual stability. The figure below shows these different states as an example of a thermally stressed protein (apoflavodoxin).

Stability Measurement
Which molecules are most susceptible to changes in stability?
In general, protein molecules that are neutral in surface charge or have hydrophobic surfaces are prone to interact with each other and hence cause changes in stability. This propensity is highly dependent on the primary amino acid sequence as well as which types of amino acids are dominant in the protein. If there are more hydrophilic and charged amino acids on the surface of the proteins, they will be less susceptible to aggregation caused by surface interactions. On the other hand, if the proteins are folded in such a way that a lot of the hydrophobic amino acids are exposed on the surface, they will be more susceptible to changes in stability. As a result, proteins that have mutations in their primary sequence are likely to suffer from stability issues. In specific applications, however, site-specific mutations are designed on purpose to enhance the stability or activity of a protein.
Stability Measurement
What causes proteins to lose stability?
Unavoidable changes in temperature, pH or just moving the sample can trigger, for example, oligomerization or unfolding processes which can decrease the stability of the protein towards further stresses. The mechanisms that lead to protein instability can be diverse. The different mechanisms that can lead to a loss of stability in monoclonal antibodies are summarized in a review by Le Basle et al. (Le Basle, Yoann, et al. Physicochemical stability of monoclonal antibodies: a review." <em>Journal of Pharmaceutical Sciences</em> 109.1 (2020): 169-190.)
Stability Measurement
Which protein structure is most stable?
Protein stability is dictated by the type of interactions that help the folding of the entire protein molecule. The primary structure of proteins is the most stable since the protein sequence is held together by covalent bonds between individual amino acids. Some of the tertiary structures that are held together by disulfide bonds are the most stable other than the primary sequence of the protein. Among the non-covalently bound structures, protein secondary structure is the most stable due to the predominant hydrogen bonding interactions.
Stability Measurement
Can loss of stability occur at all steps of the drug development process?
Yes, loss of stability can occur at all steps of the drug development process, including early discovery, pre-clinical research and development, formulation, and clinical development. Common factors that can cause the loss of protein stability in early discovery stage include process temperature of proteins, freeze/thaw cycles of proteins, agitation stress of proteins, protein concentration, etc. In the later drug development stage, such as formulation, the goal is to maximize protein stability by choosing the best excipients and buffers for the proteins.
Stability Measurement
How is stability detected and measured (tools, etc)?
Stability can be defined in many ways based on what the applied stress is. In most cases, stability is inferred based on the protein’s melting temperature (Tm). If a protein can withstand higher temperatures without unfolding, that protein is said to be more stable. There are multiple tools for measuring melting temperature including DSF, DSC, and CD.
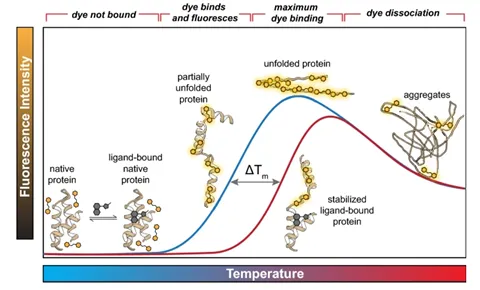
The figure above shows the quantification of stability through the melting temperature determined by differential scanning fluorimetry (DSF). The melting temperature is the temperature that causes the protein to be halfway unfolded, and the higher the melting temperature, the more stable the protein. This figure shows that the melting temperature increases when it’s bound to a ligand. (Samuel, Errol LG, et al.) "Processing binding data using an open-source workflow." Journal of Cheminformatics 13.1 (2021): 1-11.)
However, there are many other forms of stress other than temperature such as agitation, pH, pressure, light exposure etc. It is also important to understand the structure and stability of a biologic under all likely production conditions. MMS is another tool that can measure the protein structure after being exposed to any of these stresses and that can help predict the protein stability.
Stability Measurement
Which secondary structures are associated with stability loss and the current limitations to detect such?
The loss of alpha-helix or beta-sheet structure and the formation of intermolecular beta-sheet is associated with stability loss. FT-IR and CD are the most prevalent techniques to detect these secondary structures. However, FT-IR suffers from low sensitivity and reproducibility to detect small changes in the secondary structure. CD on the other hand is limited by a low concentration range and less sensitive towards the prediction of beta-sheet compared to alpha-helix structures.
Stability Measurement
What can help us prevent loss of stability?
Minimizing the amount of stress that a protein or biologic undergoes (temperature, agitation, pH swings) will help mitigate loss of stability. Additionally, certain excipients can be added to formulation buffers to help protect against the stresses that are unavoidable. Some examples of excipients used to increase stability are amino acids, sugars, salts, or small amounts of surfactants.
The application note titled “Detecting Protein Conformational Change Due to Ligand Binding and Stabilization Using MMS” details the stabilizing effects ligands can have. In this study, a protein was exposed to 50°C overnight. There were 3 different conditions: 1) protein alone(Apo), 2) protein + ligand 1, and 3) protein + ligand 2. The results show that when the protein is exposed to heat stress, there is a large increase in the the beta-sheet features and a decrease in alpha-helix. However, when in the presence of ligand 2 the effect of heat is much less dramatic, and the heat has the least impact on the sample bound to ligand 1. This indicates that ligands 1 and 2 both exhibit stabilizing effects on the protein, and ligand 1 has the most stabilizing effects.
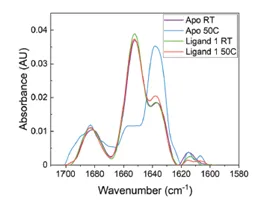
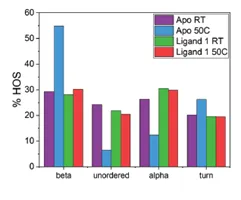
The figures above are from the application note and show MMS data collected of a protein unbound (Apo) and bound to Ligand 1 and how 50°C heat stress overnight affects the structure of the protein. The heat stress drastically changes the structure of the Apo protein but has very little effect on the protein that is bound to ligand 1. This data shows that the ligand stabilizes the protein against heat stress.
Stability Measurement
Can different formulation buffers be used to increase stability?
Yes! There are many different additives/excipients/preservatives that can be added to formulation buffers to increase a biologic’s stability. It is important that the additives do not interfere with the function or structure of the biologic, so all functional assays and characterization must be completed in the final formulation buffer that includes any additives. Some examples of additives used to increase stability are amino acids, sugars, salts, or small amounts of surfactants.
Batabyal et al. emphasize the importance of proper buffer formulation and characterization in the article “Shaping IR Spectroscopy into a Powerful Tool for Biopharma Characterization.” In this study, polysorbate 80 (PS 80) was introduced to the formulation buffer for a monoclonal antibody. PS 80 is commonly used in aqueous drug products to increase stability; however, it is important that the introduction of PS 80 does not change the structure or function of the drug product. MMS had no issues with buffer or excipient interference and generated clean protein structural information that showed PS 80does not affect the structure of the monoclonal antibody.
A different example can be seen in the application note titled “Using MMS to Measure Buffer-Induced Structural Changes in an Alpha-helix Rich Enzyme,” where the buffering conditions did impact the structure of lysozyme. Four different buffering conditions were tested, and it was determined that lysozyme has the highest fractional contribution of alpha-helical structure when it’s in tris buffer compared to water, phosphate buffer, and PBS. Lysozyme is the most active when in tris buffer and this may be due to the optimized structure with higher alpha-helical content. Since the active site of lysozyme is sandwiched between regions of alpha-helix, it makes sense that loss in alpha-helical content would result in less activity.
Stability Measurement
Is all stability loss in proteins reversible/irreversible?
Some stability lossesin proteins are reversible but some are irreversible. A method to predict whether the stability loss is reversible or irreversible is to identify what kind of change in the protein is causing instability. If the change comes from the secondary structures, there is a high probability that the stability loss is irreversible, especially in the case of beta-amyloid formation. If the change comes from the tertiary or quaternary structures, the stability loss is more likely to be reversible. For example, reversible aggregation due to the surface interaction of proteins will cause a temporary loss of stability. Reversible stability loss can be fixed by changing the formulation to separate protein monomers.
Stability Measurement
How do I setup an experiment to find the formulation condition where stability of proteins starts to decline?
Experiments that directly probe the loss in stability would be accelerated stability studies where a protein or biologic is exposed to higher-than-normal stress conditions to help predict when that drug product will fail and gauge the ttheshelf-life and storage conditions. Accelerated stability studies involve testing a range of stresses like temperature, agitation, pH, and light exposure.
An example of an accelerated stability study using MMS can be seen in the application note titled “Biosimilar Comparison and Accelerated Stability Predictions Based on <2% Secondary Structure Differences Using MMS.” In this study, insulin originator (Humalog) and a biosimilar were compared and the biosimilar was exposed to 4 or 30°C for 8 weeks to determine its structural stability. The data show small structural changes due to the heat stress and it is correlated with a loss in alpha-helix, unordered, and turn features, and increase in beta-sheet content. Structural information can be useful for stability studies to understand what happens when a protein becomes unstable.
Stability Measurement
What can be done if loss of protein stability is detected?
Loss in protein stability can manifest in multiple different ways, I.e., the protein could unfold, self-associate into oligomers, or structurally aggregate into fibrils. The strategy for addressing loss in stability will depend on how the protein is manifesting that loss. For example, colloidal aggregates can be addressed using different formulation conditions to help dissociate the oligomers. However, if the samples are unfolding or structurally aggregating, the solution may be tore-engineer or make mutations to the original construct to make it less hydrophobic.
Stability Measurement
Why is stability important?
Stability, or the ability of a protein or biologic to withstand stresses, is crucial for its activity in a final formulation. A higher tolerance towards external stresses gives rise to better activity, safety, and a longer shelf-life of the final product.
Stability Measurement
What are the consequences of loss of stability?
A loss of stability may give rise to a loss in protein activity or may even cause unwanted side effects. A less stable protein is prone to aggregation and irreversible structural changes.
Structure Measurement
Why is protein structure important?
Protein structure in general is important for the protein function/ activity on the one hand and stability/ aggregation tendency on the other hand. Both the global protein structure, and 3D arrangement as well as local structural motifs and interactions determine those protein properties.
Resources:
Protein Analysis Tools: Higher Order Structure of Insulin | RedShiftBio
Using MMS to Measure Buffer-Induced Structural Changes in an Alpha-helix Rich Enzyme| RedShiftBio
Measuring Buffer-Induced Structural Changes in a Beta-sheet Rich Protein using MMS |RedShiftBio
Structure Measurement
What are the levels of protein structure characterization?
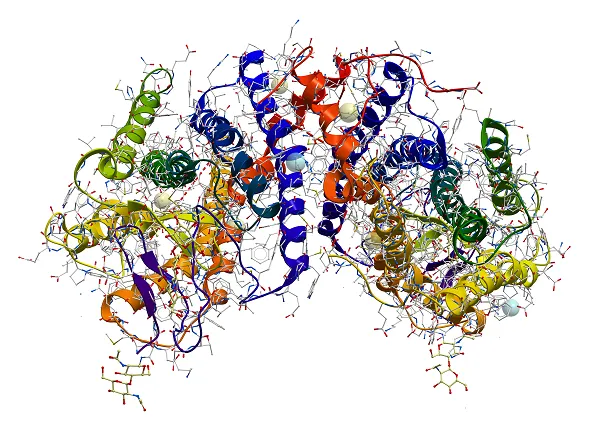
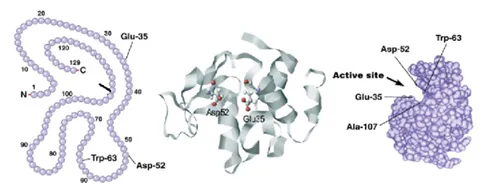
Characterization of protein structure can be separated into four structural levels, namely primary, secondary, tertiary, and quaternary protein structure. Primary protein structure determines the sequence of amino acids within a protein. The other levels describe the higher-order structure (HOS) of a protein. The local protein structure, mostly comprising a part of its sequence, is called secondary structure. Tertiary structure is the 3D arrangement of a protein, consisting of several secondary structural components within one amino acid sequence. The 3D arrangement of protein structures that include more than one sequence is called quaternary structure. The figure below provides an overview on the different levels of protein structure using proliferating cell n (PCNA) as an example:
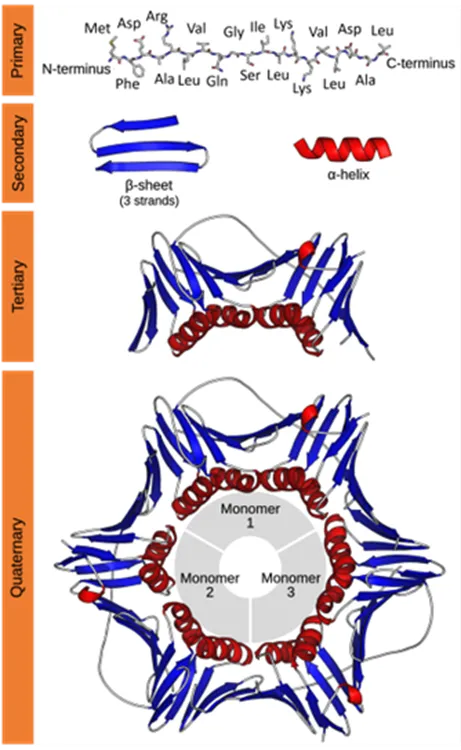
Figure from: Images by By Thomas Shafee - Own work, CC BY 4.0, (https://commons.wikimedia.org/w/index.php?curid=52821068)
Structure Measurement
How does protein sequencing differ from measurement of protein higher order structure?
Protein sequencing provides the sequence of amino acids within one protein while measurements of protein higher order structure provide the protein’s 3D arrangement either locally (secondary) or globally (tertiary and quaternary).
Structure Measurement
What does the term secondary structure refer to?
Secondary protein structure refers to the local structure of individual parts of the protein sequence. It is driven by intra- and intermolecular interaction of the protein. Typical protein secondary structural motifs are α-helix, parallel and antiparallel β-sheet, turn, and random coil. Usually, proteins consist of several secondary structural components which build up their tertiary structure.
Structure Measurement
What are some benefits of measuring secondary structure compared with the other levels of protein structure?
Secondary structure provides direct access to the protein’s function and stability since the global protein structure and shape are closely related to the relative abundance of secondary structural motifs. Changes in the global properties of the protein are often accompanied by secondary structural change. Compared to tertiary and quaternary protein structures which require high experimental effort, secondary protein structure is comparably easy to access, for example through vibrational spectroscopy. On the other hand, secondary protein structure also serves as an ideal reporter on local structural changes, e.g. through binding events or the onset of protein structural aggregation processes.
Structure Measurement
What do changes in secondary structure tell us about a protein?
As secondary structure predicts the tertiary structure of a protein, changes in secondary structure, i.e., alpha-helix and beta-sheet, can lead to drastic changes in the protein globular structure, thereby affecting the function or activity of the protein. Additionally, the secondary structure is a key determinant of protein aggregation. The tendency of forming beta-sheets from a primary sequence dictates the likelihood of aggregate formation. Conversely, sequences with a high tendency of forming alpha helices are less likely to form aggregates. (Uversky, et al. Protein Misfolding, Aggregation, and Conformational Diseases. In Protein Reviews; Springer, 2006; Vol. 4.) Asa result, changes in secondary structure can lead to the formation of disease-associated proteins such as β-amyloids (Soto, et al. Protein Misfolding and Disease; Protein Refolding and Therapy. FEBS Lett 2001, 498,204–207.)
Structure Measurement
What causes proteins to undergo secondary structural change?
As the secondary structure of a protein is predominantly held together by hydrogen bonding, the root cause of a change in protein secondary structure is always the loss of hydrogen bonding interactions. The hydrogen bonding interactions can be compromised by both intrinsic and external factors. Mutation of the primary sequence during protein expression can cause a loss of hydrogen bonding interactions in the protein secondary structure, leading to misfolding of the protein higher order structure. In addition, external stress such as process temperature, freeze/thaw cycles, ionic strength of the buffer, etc. can also affect the correct hydrogen bonding formation.
Structure Measurement
What can help us prevent change to protein secondary structure?
The stability of secondary structure of a protein is affected by both its primary structure and the external environment such as buffer, temperature, and pH. To prevent changes to protein secondary structure caused by these factors, proper formulation is often developed so that the hydrogen bonding interactions that stabilize the secondary protein structure can be strengthened. Typical excipients added to the formulation to prevent protein structural change are amino acids, sugars, salts, and surfactants.
Structure Measurement
Is all structural change in proteins reversible/irreversible?
Structural changes in protein can be either reversible or irreversible. Changes in protein secondary structure are more likely to be irreversible as it is usually associated with loss of hydrogen bonding interactions. One example is beta-amyloid formation, which causes disease-related irreversible protein aggregation. However, lyophilization has been shown to cause reversible changes in protein secondary structure by increasing the beta-sheet content and decreasing the alpha-helix content (Klibanov et al. Lyophilization-induced reversible changes in the secondary structure of proteins. Proc Natl Acad Sci.1995;92(24):10969-76.) In addition, changes in tertiary or quaternary structures are more likely to be reversible. For example, aggregations due to the surface interaction or self-association of proteins that potentially alter the globular structure of the proteins and hence affect their activity or function, can be fixed by changing the formulation to tamper the surface interactions and separate the protein monomers.
Structure Measurement
Can a change in protein structure occur at all steps of the drug development process?
Yes, protein structural change can occur at all stages of the drug development process, including early discovery, pre-clinical research and development, formulation, and clinical development. Common factors that can cause protein secondary structural change in the early discovery stage include process temperature of proteins, freeze/thaw cycles of proteins, agitation stress of proteins, protein concentration, etc. In the later drug development stage, such as formulation, the goal is to maximize the stability of secondary protein structures by choosing the best excipients and buffers for the proteins.
Structure Measurement
How is protein structural change detected and measured (tools, etc)?
The tools for measuring protein structure will depend on the level of detail required. Protein primary structure is measured by mass spectrometry, and this would be testing for differences in the amino acids sequence.
Secondary protein structure can be measured by Microfluidic Modulation Spectroscopy (MMS), Fourier-Transform Infrared (FTIR), or Circular Dichroism (CD) and is looking for differences in the fractional contributions of protein structures like alpha-helices and beta-sheets.
Tertiary and quaternary protein structure can be measured with Nuclear Magnetic Resonance(NMR), X-ray crystallography, or Cryogenic-Electron Microscopy (cryo-EM). These tools will give the highest resolution for determining protein crystal structures.
Quaternary protein structure can be measured with sizing techniques such as Size Exclusion Chromatography (SEC) or Dynamic Light Scattering (DLS) and is useful for testing oligomeric states and protein aggregation.
Structure Measurement
What are the current limitations to detect changes in protein secondary structure
The two legacy tools available for protein secondary structure measurement are CD and FTIR, both of which have some limitations:
CD measures protein structure by probing the chirality, which is a good way for detecting protein secondary structure, however, many small molecules and buffer components will also have chiral features. This makes for many buffering or formulating conditions that have high signal interference and need to be buffer exchanged into a simpler buffer. Additionally, CD is most useful for protein samples at low concentrations (typically < 1 mg/mL), therefore, protein samples formulated at higher concentrations may have to be diluted in order to not saturate the detector.
FTIR, on the other hand, requires protein concentrations that are typically >10-20 mg/mL. This leaves a gap between CD and FTIR and limits each of them from testing under a wide range of formulation conditions without modifying the protein sample in some way. Additionally, FTIR is a very manual workflow, requiring a lot of time.
MMS addresses these limitations by enabling a wide protein concentration range of ~0.1-200 mg/mL with little interference from formulation buffers. MMS has also implemented a fully-automated sample handling system that aids with running the protein samples and analyzing the results.
Structure Measurement
How do I set up an experiment to find the formulation condition where structure of proteins starts to decline?
One could design an experiment that directly probes the loss in protein stability by performing an accelerated stability study where a protein or biologic is exposed to higher-than-normal stress conditions to help predict when that drug product will fail and gauge the shelf-life and storage conditions. Accelerated protein stability studies involve testing a range of stresses like temperature, agitation, pH, and light exposure.
One example of an accelerated protein stability study using MMS can be seen in the application note titled “Biosimilar Comparison and Accelerated Stability Predictions Based on <2% Secondary Structure Differences Using MMS.” In this study, insulin originator (Humalog) and a biosimilar were compared and the biosimilar was exposed to 4 or 30°C for 8 weeks to determine its structural stability. The data show small protein structural changes due to the heat stress and it is correlated with a loss in alpha-helix,unordered, and turn features, and increase in beta-sheet content. Protein structural tnformation can be useful for stability studies to understand what happens when a protein becomes unstable.
Structure Measurement
What is the difference between secondary structure prediction and measuring change in secondary protein structure?
Tools like AlphaFold are ground-breaking in their ability to predict protein secondary structure based on the amino acid sequence of a protein or peptide. However, the secondary protein structure can be different depending on the formulation, and tools like AlphaFold currently can’t predict how the environment affects the protein structure. Similarly, it is important to test protein samples experimentally to validate computer simulation results even when they can approximate formulation conditions. These prediction tools are great for screening and minimizing the number of wet-lab candidates that have to be manufactured and screened, but it will always be important to experimentally test the lead protein candidates suggested by simulations.
Structure Measurement
Are bioinformatics used to measure change in protein structure?
Bioinformatics are most often linked to the organism genome and protein primary sequence as opposed to the structure. However, these tools can absolutely be useful in combination with protein structure characterization to help complete the story. For example, the figure below shows how it is possible to link up the primary sequence to the three-dimensional structure. Bioinformatics could help identify evolutionarily conserved regions, like active sites or binding pockets of the protein and therefore, regions of most importance for the protein function.
MMS Technology
Are there benefits to using absorption methods such as MMS, FTIR or CD complementary to scattering methods like DLS?
Yes! In addition to particle sizes interrogated with DLS, absorption methods provide fundamental structural insights. In the case of proteins, this helps to understand underlying mechanisms that may stabilize or destabilize protein formulations, for example as a response to external stresses or in course of binding events.
MMS Technology
What is the difference between absorption spectroscopy and scattering techniques?
In absorption spectroscopy, the interaction of matter with EMR is interrogated by sending radiation through a sample and recording the portion that is transmitted. The difference between incoming and transmitted light, i.e. absorption, provides fundamental information about the nature of that sample. As detailed above, the information obtained from this kind of experiment depends on the frequency range of the EMR used. As an example, IR absorption spectroscopy probes molecular vibrations which may provide structural and dynamic information about the studied sample. In MMS, the frequency window used is the so-called Amide I band which allows for secondary structural decomposition of protein samples.
In contrast to transmission absorption methods, scattering techniques record the light that is scattered from samples constituent. There are mainly two different scattering mechanisms, namely elastic (Rayleigh) and inelastic scattering. Inelastic can also be used to get spectral information about a sample due to absorption or emission. An example of that is Stokes/Anti-Stokes Raman spectroscopy. Rayleigh scattering can be used to study the size of small particles by recording the fluctuation of scattered light resulting from Brownian motion of particles in solution. This principle is used in Dynamic Light Scattering (DLS) to study the formation of protein aggregates by identifying particle size distributions. A detailed introduction to DLS is given in this video: Dynamic Light Scattering – Structure Matters (structure-matters.com)
MMS Technology
How does circular dichroism compare to MMS as a protein spectroscopy technique?
Both circular dichroism (CD) and MMS are spectroscopic techniques that measure protein secondary structures. Both these techniques are known for their high sensitivities and the ability to provide accurate assessment of the secondary structures. These techniques differ by their principles. Because proteins are chiral molecules, they interact with circularly polarized light, and the different secondary structures in protein give rise to differential absorbance upon interactions with left-handed and right-handed polarized light. CD uses this principle to detect the different secondary structures in proteins. MMS on the other hand, probes the vibrational responses of the backbone carbonyl groups of the protein. For CD, the signal quality depends on the total absorbance of a sample. Because of this limitation, the concentration range for CD is narrow (0.01-1 mg/mL) and the buffer compatibility is poor. In contrast, because MMS uses IR spectroscopy and allows for real-time buffer subtraction, it allows a wide range of absorbance and is not limited by buffer signals. MMS can measure samples at a wide concentration range (0.1-200 mg/mL) and is compatible with most buffers and excipients. A direct comparison between CD, FTIR and MMS is given in this application note:
MMS Technology
How does Fourier Transform Infrared compare to MMS as a protein spectroscopy technique?
Fourier Transform Infrared (FTIR) and MMS are both IR-based spectroscopic techniques, meaning that the way they probe the proteins (backbone carbonyl groups) is the same. Therefore, both techniques measure the secondary structure of proteins. The main differences between FTIR and MMS are the sensitivity and concentration range. With the high-power quantum cascade and the microfluidic flow cell that allows for real-time buffer subtraction, MMS largely improves the signal-to-noise ratio and provides 30x sensitivity compared to FTIR (Kendrick, B. S.; Gabrielson, J. P.; Solsberg, C. W.; Ma, E.; Wang, L. Determining Spectroscopic Quantitation Limits for Misfolded Structures. Journal of Pharmaceutical Sciences 2020, 109 (1), 933–936. https://doi.org/10.1016/j.xphs.2019.09.004).
Typically, FTIR requires high concentration of proteins (10 mg/mL) for measurements, but MMS can measure proteins at a range from 0.1 to >200 mg/mL. In addition, compared to FTIR’s manual workflows, MMS is a fully automated technique. An entire workflow from high throughput (up to 96-well plate) sample measurement to cleaning, baselining, and data analysis can be done with a single mouse click using MMS.
MMS Technology
What are some key factors to consider when quantifying protein concentration using IR spectroscopy vs other spectroscopic methods?
IR spectroscopy probes the amide carbonyl group in the protein backbone, and as a result the IR absorbance is directly proportional to the number of amide groups in a protein. IR absorbance is therefore a direct measurement of the overall mass of the protein. One important factor to consider is that because the backbone carbonyl groups can form different hydrogen bonds depending on the type of secondary structures they are in, the IR absorption peak can be in a range, between 1600 and 1700 cm-1,or 5882 and 6250 nm. UV-vis spectroscopy on the other hand, probes the aromatic groups in the protein which mainly come from the side chains of specific amino acids such as tryptophan, tyrosine, and phenylalanine. These groups have a peak absorption at 280 nm, commonly known as A280. The major limitation using A280 to quantify protein concentration is that as the size of the protein gets smaller, the portion of these aromatic amino acids in a protein become more inconsistent. For small peptides that lack certain aromatic amino acids, UV-vis becomes inaccurate or even impossible to quantify concentrations.
MMS Technology
Why is it important to use spectroscopy to measure protein concentration alongside protein structure?
Other than providing structural information about the proteins, spectroscopy allows a quick and easy way to quantify protein concentration using the Beer-Lambert Law, or Beer’s Law. For proteins in solution, Beer’s Law states that when light passes through the solution, the absorbance is proportional to the concentration of the protein, given that the optical path length and the absorptivity of the protein stay constant. This gives spectroscopic techniques advantages to not only analyze protein structures but also provide accurate quantification of protein concentrations.
MMS Technology
Is Microfluidic Modulation Spectroscopy used only to characterize protein?
MMS can be used to characterize any biomolecules that have distinct absorbance in the amide I region of the IR spectrum, for example: nucleic acids and AAVs are both emerging applications areas for MMS.
Stay tuned for upcoming app notes in these areas!
MMS Technology
Is MMS considered a protein spectroscopy technique?
Yes! MMS uses mid-Infrared light to detect protein structure. Specifically, we use the amide I band in the IR spectrum to detect the carbonyl stretching vibration in the protein backbone. This vibration will be very different if the carbonyl bond is making hydrogen bonds as part of an alpha-helix or beta-sheet secondary structure and we can quantitate the percentages of different secondary structural motifs based on this principle.
MMS Technology
What are some of the primary applications of protein spectroscopy?
There are many different applications depending on the technique being used. Here are some examples:
UV-vis spectroscopy is used to quantitate protein concentration by using visible and ultraviolet light.
Microfluidic modulation spectroscopy (MMS) and Fourier transform infrared spectroscopy (FTIR) both use infrared light and determine protein secondary structure in the amide I band, a spectral window within the MIR region. This region is sensitive to the hydrogen bonds in the protein backbone.
Circular dichroism (CD) spectroscopy uses circularly polarized light to determine protein secondary structure using chirality.
Fluorescence spectroscopy uses intrinsic fluorescence of proteins caused by the aromatic amino acids tryptophan, tyrosine, and phenylalanine. This technique probes tertiary structure as these amino acids are hydrophobic and often hidden in the core of the protein. As a protein is unfolded, these amino acids will become solvent exposed and excitable using specific wavelengths of light.
Nuclear magnetic resonance (NMR) spectroscopy uses radio frequency pulses to excite the nuclei within samples. This is most commonly used in small molecule work, but 2-dimensional NMR can be used to study protein structure to get high resolution information about the 3-dimensional tertiary and quaternary structure.
MMS Technology
What is meant by the term "protein spectroscopy"?
Protein Spectroscopy refers to the study of proteins by using their interaction or emission of electromagnetic radiation (EMR).
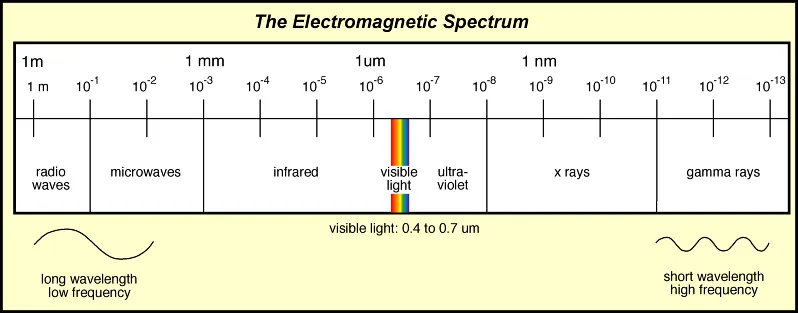
This includes the use of x-rays, ultraviolet and visible light, infrared light, microwaves, and radio waves. Some examples of protein spectroscopy techniques are: UV-vis, CD, MMS, FTIR, Fluorescence, and NMR.
Titer Measurement
What is the HaLCon "trap-and-elute technique" and how does it work?
Trap and elute means the analyte (IgG) is fully captured on the column, everything else passes through, then the analyte is released and the detector sees one peak. In terms of flow it differs from traditional liquid chromatography in that there is no gradient, just 100% reagent A to capture or trap IgG, then 100% reagent B to elute.
Titer Measurement
How does HaLCon react to other Immunoglobulins and other impurities?
The Tridex uses a Protein A media. Anything not bound to the Protein A passes through the column to waste.
Titer Measurement
How must the sample be prepared for HaLCon?
The sample needs to be filtered through a 0.2 µm or 0.45 µm filter to ensure it is free of cells and cell debris. Alternatively, the sample can be spun down and the supernatant sampled with a syringe. Users doing this need to be careful not to stick the syringe too deep in the centrifuge vial. For users familiar with HPLC, the sample can be prepared as if it were being run on HPLC because HaLCon uses a similar column and pre-column filter.
Titer Measurement
How much sample material or sample volume is required to run HaLCon?
We recommend 100 µL per sample. If you have a lower desired sample volume, please contact us and one of our experts can help evaluate the feasibility of the proposed sample volume.
Titer Measurement
Does HaLCon require any connections, e.g. water or gas, in addition to a power connection?
Nothing else but a power connection is needed.
Titer Measurement
What type of pump is used (traditional binary HPLC pump, peristaltic pump) for HaLCon?
HaLCon uses displacement/dispense pumps. They work like a syringe pump except they are composed of more durable materials for longer, maintenance-free use. Since HaLCon uses low-pressure Liquid Chromatography, the maximum pressure recommended is 200-250 psi.
Titer Measurement
What type of maintenance is required for HaLCon? And, will this maintenance be performed during a yearly PM?
No regular maintenance is required beyond changing the reagent pack and analysis module every 3 months or after running 1,000 samples, whichever comes first. It is recommended to run a flush before running samples if the system has been idle for a few days.
Titer Measurement
How do you ensure that no cells from the fermenter enter the HaLCon measuring device?
Samples should be spun down, and care should be taken to not disturb any pellets or to remove the entire sample from the centrifuge tube. Alternatively, the samples can be filtered through a 0.2 µm or 0.45 µm filter.
Titer Measurement
Does HaLCon have a built-in filter or a separator?
HalCOn does not have a built-in filter for removing samples, that must be done before loading the sample.
Titer Measurement
How can the user determine if the sample purification is functioning correctly when using HaLCon?
The best way to validate performance is by running a control sample of known concentration and verifying that the correct concentration value is returned by the software.
Titer Measurement
Can HaLCon also control the process, such as cooling down or emptying the fermenter when a specific threshold is reached? Or is it solely for monitoring purposes?
HaLCon is purpose-built for measuring protein titer, nothing else. A sample is added either manually or via an autosampler and HaLCon provides a concentration. HaLCon is compatible with multiple autosamplers, including the Flownamics Director, which may be able to automate the sampling from a bioreactor.