Protein Aggregation
Detect and Prevent Protein Aggregation
Protein aggregation results from irreversible conformational changes and misfolding at the structural level which remains a concern and challenge to biotherapeutic development. Typical indicators of aggregation include shifting ratios of alpha-helix and beta-sheet moieties with an increase in inter-molecular beta-sheet structures typically corresponding to an increase in inter-molecular protein aggregation. This occurrence directly relates to potential detrimental effects on stability, efficacy, and safety due to the precipitation of insoluble populations. Thus, it remains important to detect and prevent protein aggregation to protect the integrity of a biotherapeutic molecule within the development and formulation processes.
Track Aggregation with Microfluidic Modulation Spectroscopy (MMS)
By incorporating the novel secondary structural characterization tool Microfluidic Modulation Spectroscopy (MMS) into the biomolecular characterization workflow, it is possible to detect and track significant markers of aggregation and instability. This is accomplished by following changes in both intra and and inter-molecular beta-sheet content across an entire formulation experiment to pinpoint the conditions where aggregation started and increased. The ability to inform upstream development decisions with early and actionable results is invaluable, and with MMS, stability monitoring is easy and purpose-built into the platform to protect downstream processing.
Protein Aggregation Analysis: IgG1 Example
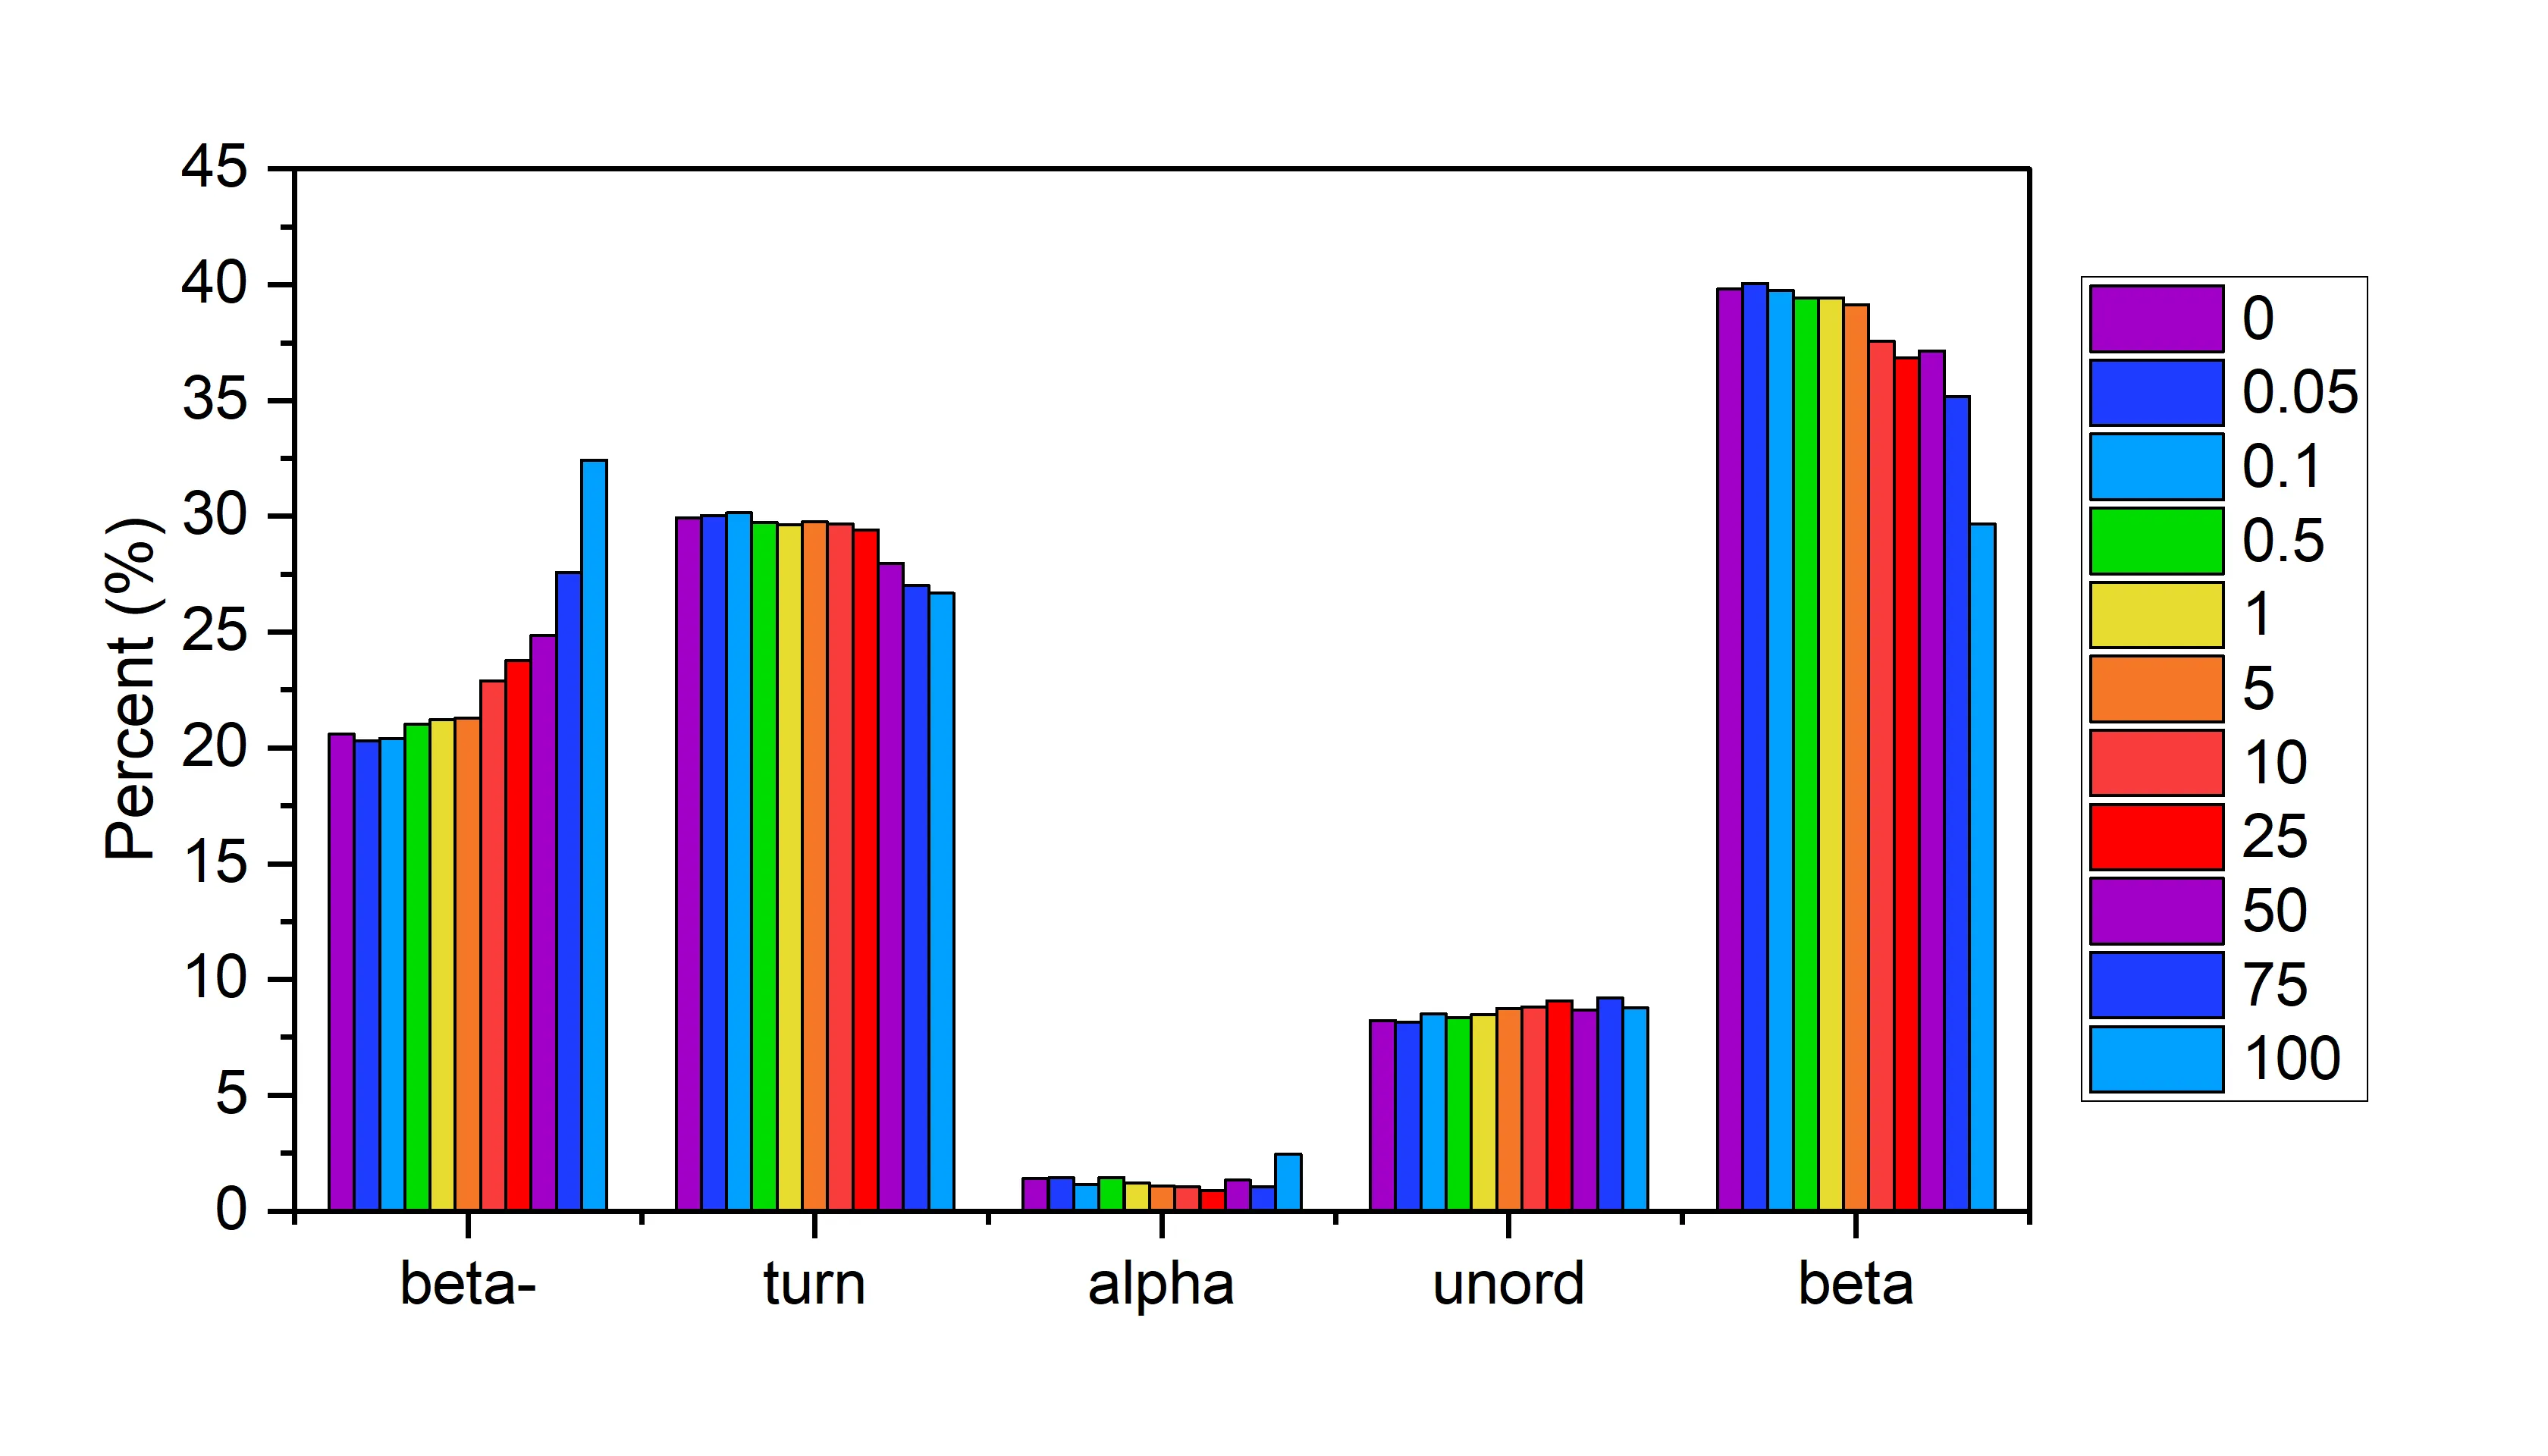
Higher Order Structure (HOS) populations measured in a pressure treated aggregated IgG1 spike series analyzed by MMS. As the concentration of aggregated IgG1 was increased from 0% to 100%, the respective and expected increases in anti-parallel beta-sheet (beta-) and decreases in parallel beta-sheet (beta) were accurately measured. Application Note Detection of Pressure Induced Aggregation using MMS.

Frequently Asked Questions About Aggregation
What is biomolecular aggregation?
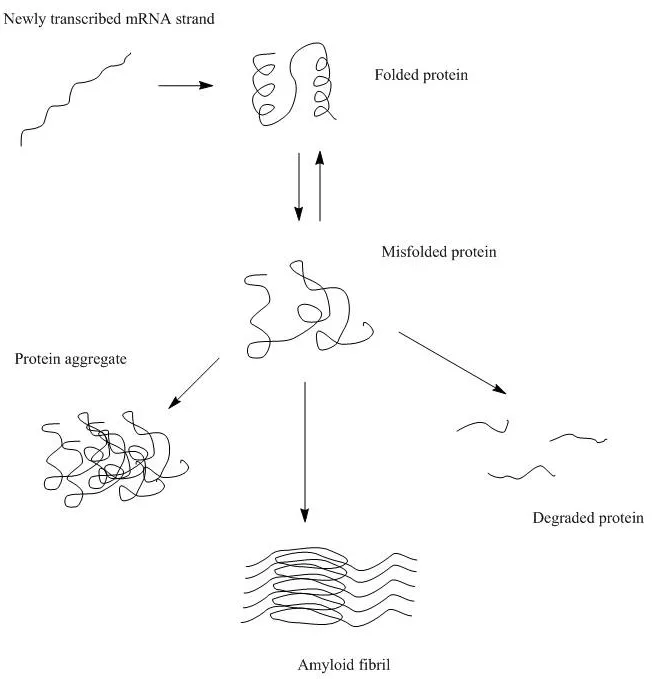
Biomolecular aggregation is a biological phenomenon where individual macromolecules, such as protein molecules cluster and clump together, forming a new entity that might have lost its original functions or activities and have the potential to cause diseases. Specifically, protein aggregation is a result of protein mis-folding, causing individual proteins to interact with one another. In the most severe cases, protein aggregation leads to the formation of irreversible, insoluble fibril structures, e.g., β-amyloids, which are responsible for neurodegenerative diseases such as Alzheimer’s and Huntington’s.
Which molecules are most susceptible to aggregation?
In non-stressed conditions, peptide formation during translation and newly expressed proteins during the folding process are susceptible to aggregation. Proteins that are under stressed conditions (I.e., heat, pH, oxidative, etc.) are also susceptible to aggregation.
What causes protein aggregation?
The direct cause of protein aggregation results from interactions between individual proteins that become thermodynamically favored. There are two main sources of such driving force behind protein aggregation:
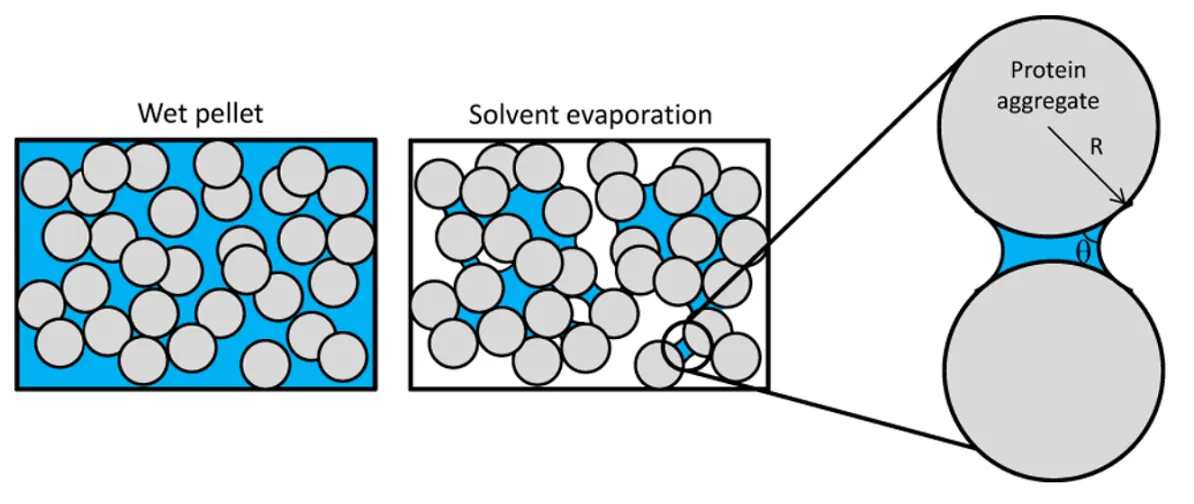
- The surface of proteins loses interaction with solvents (i.e., water molecules) and consequently exposes the hydrophobic groups that can interact with the surface of another protein undergoing the same process. Aggregates formed by such surface interactions are called colloidal aggregates.
- Mis-folded proteins fail to maintain the native structure and expose the inner hydrophobic pockets. The exposed hydrophobic pockets, primarily composed of β sheets, are prone to re-form beta interactions indiscriminately with other intra- and inter-molecular β sheets. Aggregates formed by these intermolecular β-sheets are called structural aggregates.
Can protein aggregation occur at all steps of the drug development process?
Yes, protein aggregation can occur at all stages of the drug development process, including early discovery, pre-clinical research and development, formulation, and clinical development. Common factors that can cause protein aggregation in early discovery stage include process temperature of proteins, freeze/thaw cycles of proteins, agitation stress of proteins, protein concentration, etc. It is also important to be able to detect early signs of protein aggregation or just the potential of protein aggregation during the early discovery phase.
What are the different types of protein aggregates and how do they form?
There are two different types of protein aggregates – colloidal protein aggregates and structural protein aggregates. Colloidal protein aggregates refer to the self-association of protein molecules that are still well folded in their native structure. Structural protein aggregates are the aggregates in which the protein molecules are no longer in their native folded states but a different structure. Conformational or structural protein aggregation often involves the formation of intermolecular β-sheets which is irreversible, while colloidal protein aggregates are often still reversible.
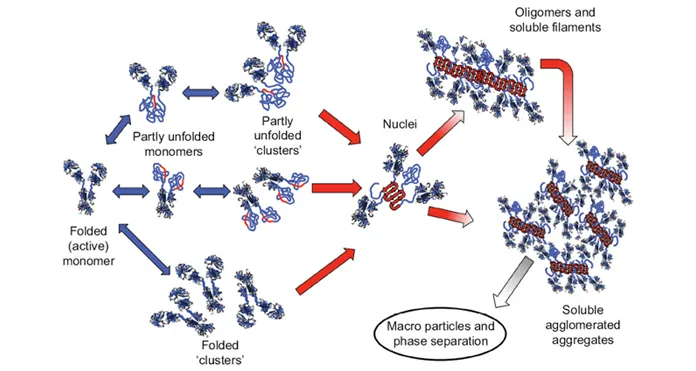
There are multiple pathways that lead to protein aggregation, as illustrated in the figure below by Christopher J. Roberts et al. (A) represents the process from partly unfolded protein monomers to partly unfolded clusters, while (B) represents colloidal protein clusters where proteins are folded well in their native structures. Both (A) and (B) protein aggregates are still reversible until it reaches (C) where inter-molecular β-sheets have formed, and it will function as nuclei that triggers further aggregation into oligomers, soluble filaments, and agglomerated aggregates. As a result, protein aggregation rates are governed by conformational and colloidal stabilities, demonstrated by John Carpenter, Eva Y. Chi et al, and many other researchers and scientists.
MMS provides a way to assess protein colloidal stability (via protein hydration) and structural or conformational stability (via secondary structural analysis) in one single automatic measurement. Stay tuned for an upcoming app note.
Schematic diagram below illustrates multiple non-native aggregation pathways for a multi domain protein such as a monoclonal antibody (mAb) composed of a single Fc fragment and two identical Fab fragments. Red strands denote ‘hot spot’ sequences that are prone to form strong, effectively irreversible inter-protein contacts that stabilize aggregates, but are primarily hidden or buried in fully folded monomers. Double arrows denote effectively reversible steps. Single arrows denote irreversible steps. Nuclei are defined as the smallest net-irreversible aggregates that form soluble aggregates spanning length scales on the order of 10 to 102 nm. This occurs primarily via addition of other partly unfolded monomers (upper right) or by the agglomeration of existing aggregates (lower right) [ref].
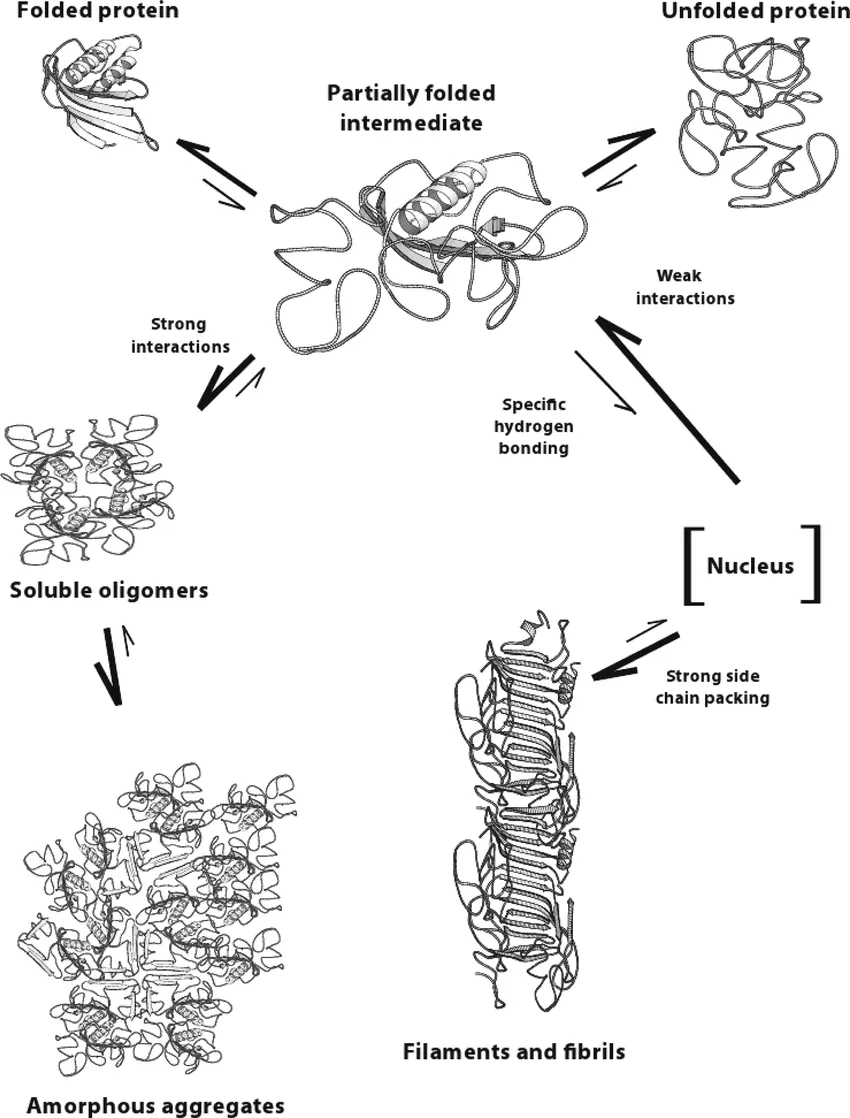
Another way to look at different types of protein aggregates, as demonstrated by Leonid Breydo et al. and Bhavana Shivu et al., protein aggregates can be divided into three structural classes: amorphous aggregates, amyloid fibrils, and oligomers. The formation of the amorphous aggregate involves the association of the solvent-exposed hydrophobic surfaces of the nativelike cores of the intermediates accompanied by the formation of intermolecular β-sheets between disordered loops, which first yields small soluble oligomers that increase in size to generate larger aggregates. Amyloid fibril formation, however, involves initial weaker hydrophobic interactions, resulting in a soluble oligomeric pre-nucleus that probably has more β-sheet formation between the disordered segments of the intermediate.
How is aggregation detected and measured (tools, etc)?
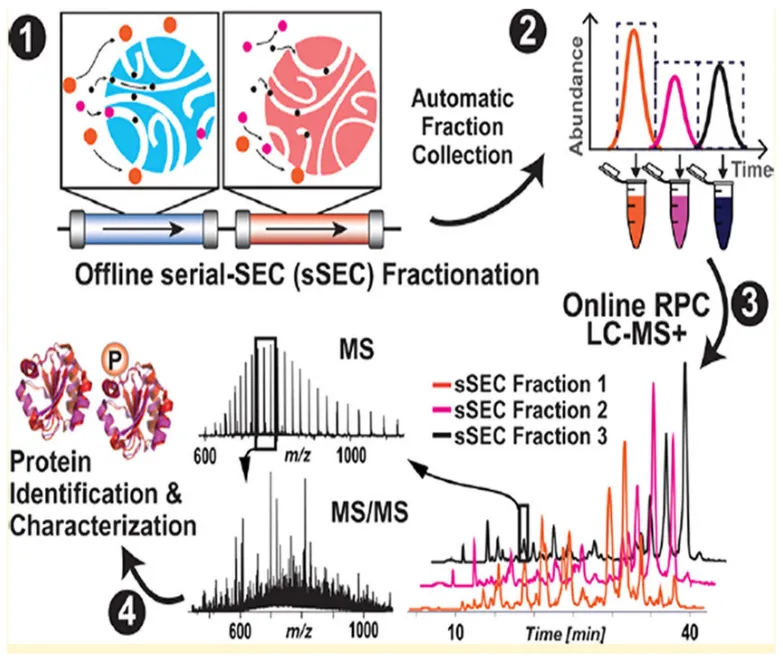
Although protein aggregates can be both colloidal aggregates and structural aggregates, today’s labs almost always only quantify size using HPLC, SEC, and AUC, techniques which do not differentiate the two types of protein aggregates.
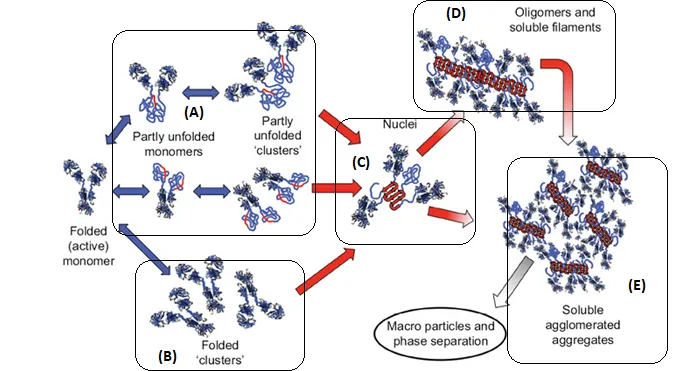
In the figure above, B-C-D-E will all appear to be a size change with no way to distinguish them apart. With the addition of MMS, we can distinguish A, B, C, D, E. More specifically, A has an overall structural change but little intermolecular β-sheets, B has no overall structural changes (spectra identical); C, D, E have both overall structure changes and intermolecular β-sheets.
Analytical tools used to detect protein aggregation
Several common analytical tools used to detect aggregates include: HPLC, SEC and AUC. These do not differentiate between two types of intermolecular aggregation. MMS is able to do this.

Which secondary structures are associated with aggregation and the current limitations to detect such?
Proteins are comprised of chains of amino acids which, in specific order, dictate structure and function as the primary structure. Aggregation is most notably associated with β-sheet formation, a structure that is present in protein biomolecules in varying amounts. Other structures that contribute to the overall secondary structure, folding, function and activity of proteins include alpha-helices, turns, and unordered regions.
As demonstrated above, the formation of intermolecular β-sheet is key to irreversible protein aggregation. However, the attention that researchers in the biopharmaceutical space pay to protein secondary structure and intermolecular β-sheet does not match their importance. This is primarily due to the limitations of traditional tools, especially their low sensitivities. That is to say, no meaningful conclusion can be drawn unless there is a very large change in protein secondary structure that goes beyond the system error.
KBI has published a paper to compare the Limit of Quantification (LOQ) of traditional Fourier-transform infrared (FTIR) spectroscopy, Circular dichroism (CD) and Microfluidic Modulation Spectroscopy (MMS) by Brent S. Kendrick et al. LOQ is defined as the smallest amount or the lowest concentration of a substance that is possible to be determined by means of a given analytical procedure with the established accuracy, precision, and uncertainty. MMS is 30 times more sensitive than traditional FTIR and 5 times more sensitive than CD.

Determining Spectroscopic Quantitation Limits for Misfolded Structures
Abstract
“Protein secondary structures are frequently assessed using infrared and circular dichroism spectroscopies during drug development (e.g., during product comparability and biosimilarity studies, reference standard characterization, etc.) However, there is little information on the lower limits of quantitation of structural misfolds and impurities for these methods. A model system using a monoclonal antibody reference material was spiked at various levels with a protein that had a significantly different secondary structure to represent the presence of a stable and discreet structural misfold. The ability of circular dichroism, transmission Fourier transform infrared spectroscopy and microfluidic modulation spectroscopy, along with various spectral comparison algorithms, were assessed for their ability to detect the presence and quantify the amount of the misfolded structure.”
How can solutions be stabilized to avoid aggregation?
To stabilize a protein formulation to avoid aggregation, we need to know how proteins are aggregated. For proteins to aggregate, the first step is to approach ~3 Å, the second step is desolvation – the removal of everything between the two proteins including water and other molecules in the formulation. Then proteins can go through structural changes over time and eventually form intermolecular β-sheets to be irreversibly aggregated. This serves as a nucleus for the formation of more intermolecular β-sheets and eventually large aggregates.
Excipients are the developer’s ingredients for engineering stable formulations. Different excipients provide different influence and control over different steps described above. The first step is governed by proximity energy and can be hindered via electrostatics, e.g. protein charges, therefore, controlling over pH, ionic strength and dielectric can be very effective.
The second step – desolvation – is governed by protein hydration and exclusive volume. Sugars, some amino acids, can help control protein hydration. Some polymeric chains can be linked to protein surfaces to increase the exclusive volume, therefore stabilizing the protein formulation.
Is all protein aggregation reversible/irreversible?
Protein aggregation can be both reversible and irreversible. Theoretically, if the protein molecule still maintains its natively folded structure, it can still be reversibly separated into single molecules. Therefore, colloidal aggregates are usually considered reversible. However, once intermolecular β-sheets have formed between protein molecules, there would be no way to reverse it back to individual protein’s native states, therefore, irreversible. One may test the reversibility by removing the stress and/or diluting the sample.
How do I setup an experiment to find the formulation condition where protein aggregation is starting?
Accelerated stability studies are usually performed on protein drug products as part of the formulation screen to see how resilient each formulation is to stress conditions like heat, agitation, freeze/thaw cycles, and light exposure. This type of study will also help inform the researcher on how shelf-stable the drug product is. The formulations to be tested should include a range of pH values and additives such as sugars, salts, preservatives, and stabilizers like amino acids. The goal of this study is to determine which protein drug formulation can withstand the most stress without the drug product aggregating.
What can be done if aggregation is detected?
If protein aggregation is detected, this is an alarming sign for potential product failure, e.g. due to loss of protein function and/or unwanted interaction. The course of action resembles that of how to prevent protein aggregation (See FAQ: Reasons to Avoid Aggregation) and depends critically on where along the biotherapeutic pipeline it is detected.
In the early development phase, i.e. formulation, there are still more degrees of freedom in both the buffer recipe and the protein itself, in order to stabilize the product. The strategy depends on the type of aggregation: Reversible colloidal protein association is often approached by controlling the electrostatics through salt and buffer components, structural protein aggregation might require changes to the protein sequence. In general, protein structures with a more densely packed (hydrophobic) core tend to be more stable. In manufacturing, the product recipe is already more sophisticated and potential changes are limited to fine tuning the buffer components. Detecting structural protein aggregation at this point is a major setback for the release of this product. For released products, aggregation is a serious quality issue which requires retraction of that product and adjustments in the buffer and/or the protein sequence.
What are the reasons to avoid aggregation?
Protein aggregates can be immunogenic. It is generally accepted that the immunogenic risk of aggregated protein drug molecules is correlated with its reversibility. Specifically, irreversible protein aggregates are more immunogenic. For the same mass of materials, smaller (e.g. 20nm) protein aggregates have a stronger immunogenic response due to the much greater amount of them. [1, 2]
MMS can quantify intermolecular protein β-sheets with ultra-sensitivity. This will determine the amount of irreversible protein aggregates which cannot be achieved by measuring size using DLS, NTA, MFI, or SEC. Here are some app notes that demonstrate how MMS irreversible protein aggregation.
AN_850_0109 - Detection of Pressure Induced aggregation using MMS
Abstract:
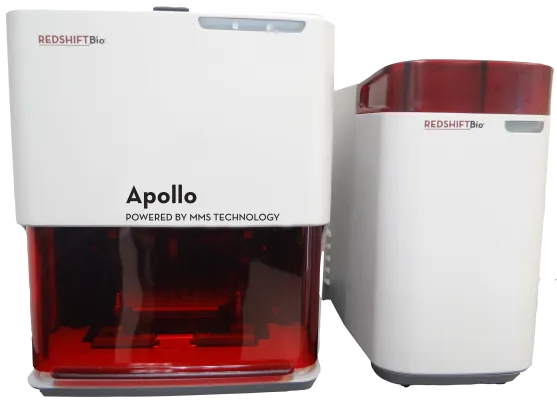
The RedShiftBio AQS3®pro system, powered by Microfluidic Modulation Spectroscopy (MMS), enables the early detection of instability by measuring minute changes in inter-molecular β-sheet composition, an indicator of irreversible aggregation. The AQS3pro utilizes a high-power quantum cascade laser (QCL) to generate unrivaled sensitivity in secondary structure determination over a wide concentration range. The ability to see change in inter-molecular β- sheet composition through stability monitoring at selected wavenumbers by MMS creates an advantage of correlating drug development conditions to potential detrimental effects on protein function at all stages of drug development.
AN_850_0101 Thermal Denaturation Analysis of Bovine Serum Albumin over Wide Concentration Range by Microfluidic Modulation Spectroscopy
Abstract:
Microfluidic Modulation Spectroscopy (MMS) is a powerful new infrared spectroscopy tool for protein structural analysis developed by RedShift BioAnalytics. This technology provides significant increases in sensitivity, dynamic range, and accuracy for determination of protein secondary structure relative to conventional mid-IR and far-UV CD techniques. The analyzer utilizes a tunable Quantum Cascade Laser that is at least 1000 times more intense than conventional light sources, allowing for optimal signal-to-noise ratio to achieve ultra-high sensitivity. This sensitivity allows MMS to see changes missed by other technologies and gives you greater confidence in your biophysical characterization. More intense light sources also allow the use of simpler detectors without the need for liquid nitrogen cooling. Additionally, the sample (protein) solution and a matching reference buffer stream are automatically introduced into a microfluidic flow cell, and the two fluids are rapidly modulated (1-4 Hz) across the laser beam path to produce nearly drift-free background compensated measurements.
Can I use micro-filtration to remove aggregates?
Protein aggregates and other large particulates can be removed from samples that are being prepared for MMS typically by using a 0.2 um filter, or centrifuging to pellet the aggregates and use the supernatant. Removing large protein aggregates and particulates will help extend the lifetime of the flow cell as large aggregates can accumulate in the flow cell and slow the flow rate over time. If the flow rate slows, the options are to perform cleaning procedures or replace the flow cell with a new one.
If aggregation is so bad, how can I prevent it?
Knowing the aggregation pathway will save your time and effort in solving your protein aggregation problems, developing formulations, and narrowing down leads. To solve reversible protein colloidal association, we usually consider controlling electrostatics using salt and buffers, i.e. to increase the charges or adjust the charge distributions on the surface). To alleviate reversible protein structural unfolding, we usually consider controlling co-solute affinity which governs the desolvation step using sugars and amino acids and the like. Or if that's not working, we may go back to choose another lead that has a "better" protein structure. "Better" means the protein can form a tighter hydrophobic core.

